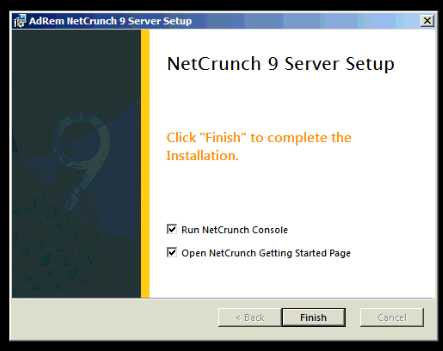
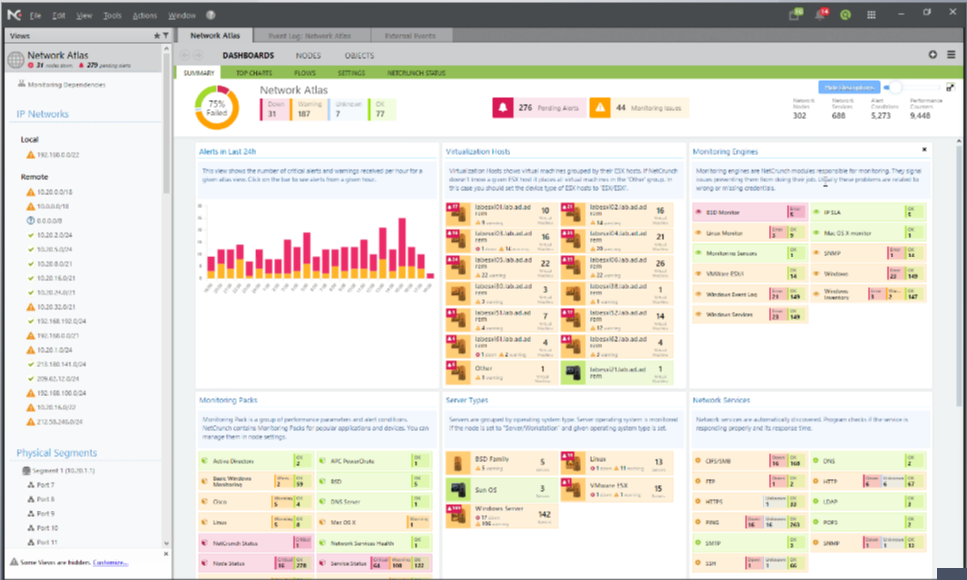
 Stumbling across the web, i found this monitoring system by the #team of Adrem Software i decide to try NetCrunch – Monitoring System, is a pay system but you can easily try out a 30 days demo, i was curious to see the performance of this monitoring system especially because i had used Zabbix and Nagios before, so what NetCrunch – Monitoring System has to offer to compete whit this other software, lest take a walkthrough together and review this software, first lest cover the download and install process, the first step is to download the application NetCrunch Server. The install process is very straightforward it has a wizard that simplifies things, choose the binary path and the data path, the web interface can listen in port 80 and with SSL protection. One way to validate a correct installation is to check the processes running the Windows program “services.msc”, that has to be 8 processes. Open NetCrunch console application from your desktop and it display the dashboard. In the dashboard you can visualize, Network Activity, per node alarms, critical network services, server groups and more, plus this screen is cuztomizable.
NetCrunch is SNMP v3 capable ready. This means that any device that has this protocol can be monitored and added to NetCrunch.
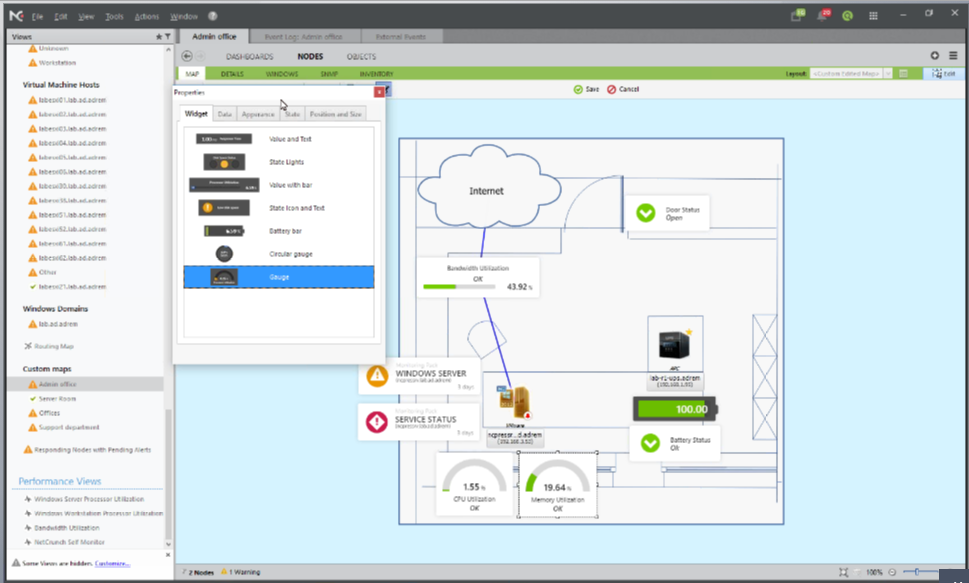
You can also monitor disk usage and free space, processes and memory usage, NetCrunch also utilize monitoring packs similar to the Zabbix Templates, this means that by adding a Linux or BSD node to the server you can start monitoring it by using a monitoring pack that have this basics alarms ready to use, also a network service pack is available, so you can start monitoring network services like FTP – HTTP – SSH in your servers, one thing a find very interesting about NetCrunch is that you can use network maps with GEO-REFERENCES like for example this screenshot:
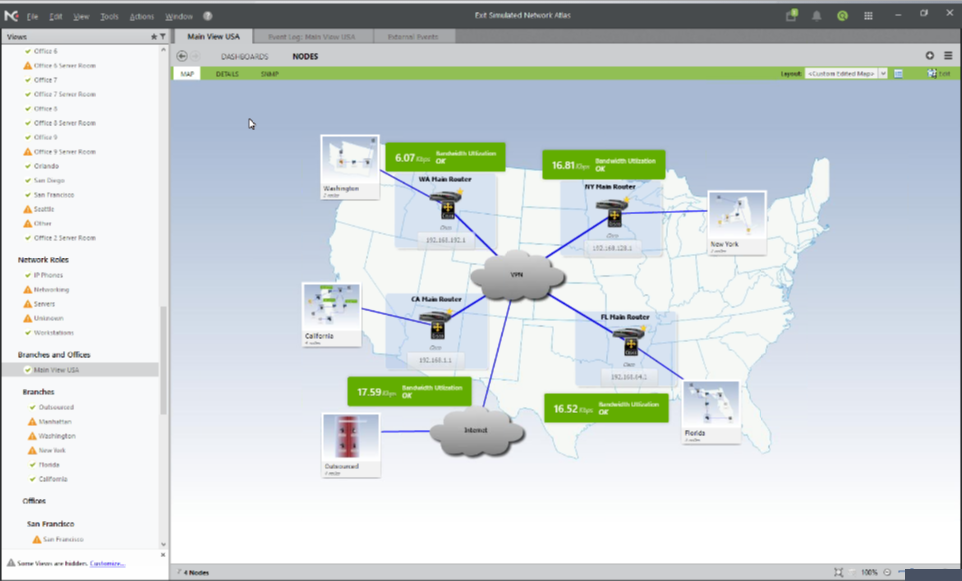
Or maybe you are monitoring servers that are distributed in a large warehouse, and finding this machines can be problematic, NetCrunch gives you the possibility to use a blue print over the network map and locate the nodes easily.
Also NetCrunch can show graphically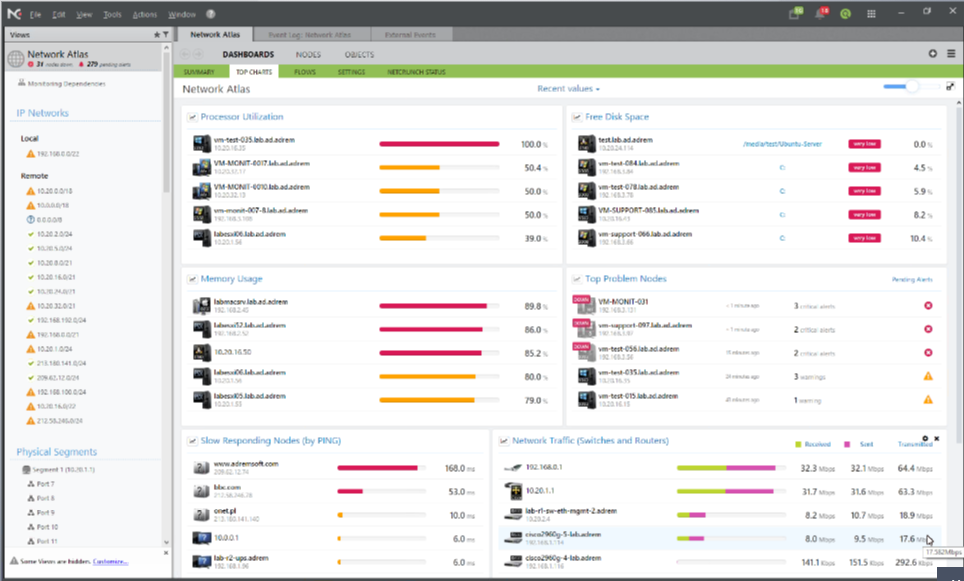 network usage and can go deeper into an specific node and generate a graphic report about the web application that is taking the bandwidth of the network. Another productive thing is the capabilities to respond to issues in the network, for example if a server goes down you can configure several methods to force NetCrunch to try to solve the problem like “wake on Lan ” action, running “Scripts” as a response of service down alarm. NetCrunch runs on Windows Server 2008R2 or newer, and requires a minimum 4GB RAM and 4 Cores. It can run on a VM with no performance degredation.
In terms of scalability: A single server of NetCrunch can monitor over 650,000 sensors (virtual or physical installation). NetCrunch uses a proprietary, embedded database. This database has no limiton the length of time you keep your data or the size. It requires no additional licensing or hardware costs associated with something like MSSQL.
A performance tip – monitoring 250 nodes (7,100 sensors) on an Intel NUC mini PC (with a Celeron!) used only about 10% of the processor on average.
Now the pricing: (there is no limit on the number of sensors/counters/elements/etc
monitored on each node):
NetCrunch 50: Up to 50 nodes: $1,755
NetCrunch 125: Up to 125 nodes: $2,855
NetCrunch 300: Up to 300 nodes: $4,395
NetCrunch 600: Up to 600 nodes: $6,700
NetCrunch 1000: Up to 1,000 nodes: $8,245
NetCrunch 2000: Up to 2,000 nodes: $13,190
NetCrunch Unlimited: No limit on node numbers (licensed per NetCrunch
server): $17,590
So there you go NetCrunch is a monitoring system that is here to stay and they are adding new features into their software in every release.